Antarctic Ice Shelf Thickness Change from Multimission Lidar Mapping
by T. C. Sutterley, T. Markus, T. A. Neumann,
M. van den Broeke, J. M. van Wessem,
and S. R. M. Ligtenberg
The Cryosphere (2019)
Abstract:
We calculate rates of ice thickness change and bottom melt for ice shelves
in West Antarctica and the Antarctic Peninsula from a combination of
elevation measurements from NASA/CECS Antarctic ice mapping campaigns
and NASA Operation IceBridge corrected for oceanic processes from
measurements and models, surface velocity measurements from synthetic
aperture radar, and high-resolution outputs from regional climate models.
The ice thickness change rates are calculated in a Lagrangian reference
frame to reduce the effects from advection of sharp vertical features,
such as cracks and crevasses, that can saturate Eulerian-derived
estimates. We use our method over different ice shelves in Antarctica,
which vary in terms of size, repeat coverage from airborne altimetry and
dominant processes governing their recent changes. We find that the
Larsen-C Ice Shelf is close to steady state over our observation period
with spatial variations in ice thickness largely due to the flux
divergence of the shelf. Firn and surface processes are responsible for
some short-term variability in ice thickness of the Larsen-C Ice Shelf
over the time period. The Wilkins Ice Shelf is sensitive to short
time-scale coastal and upper-ocean processes, and basal melt is the
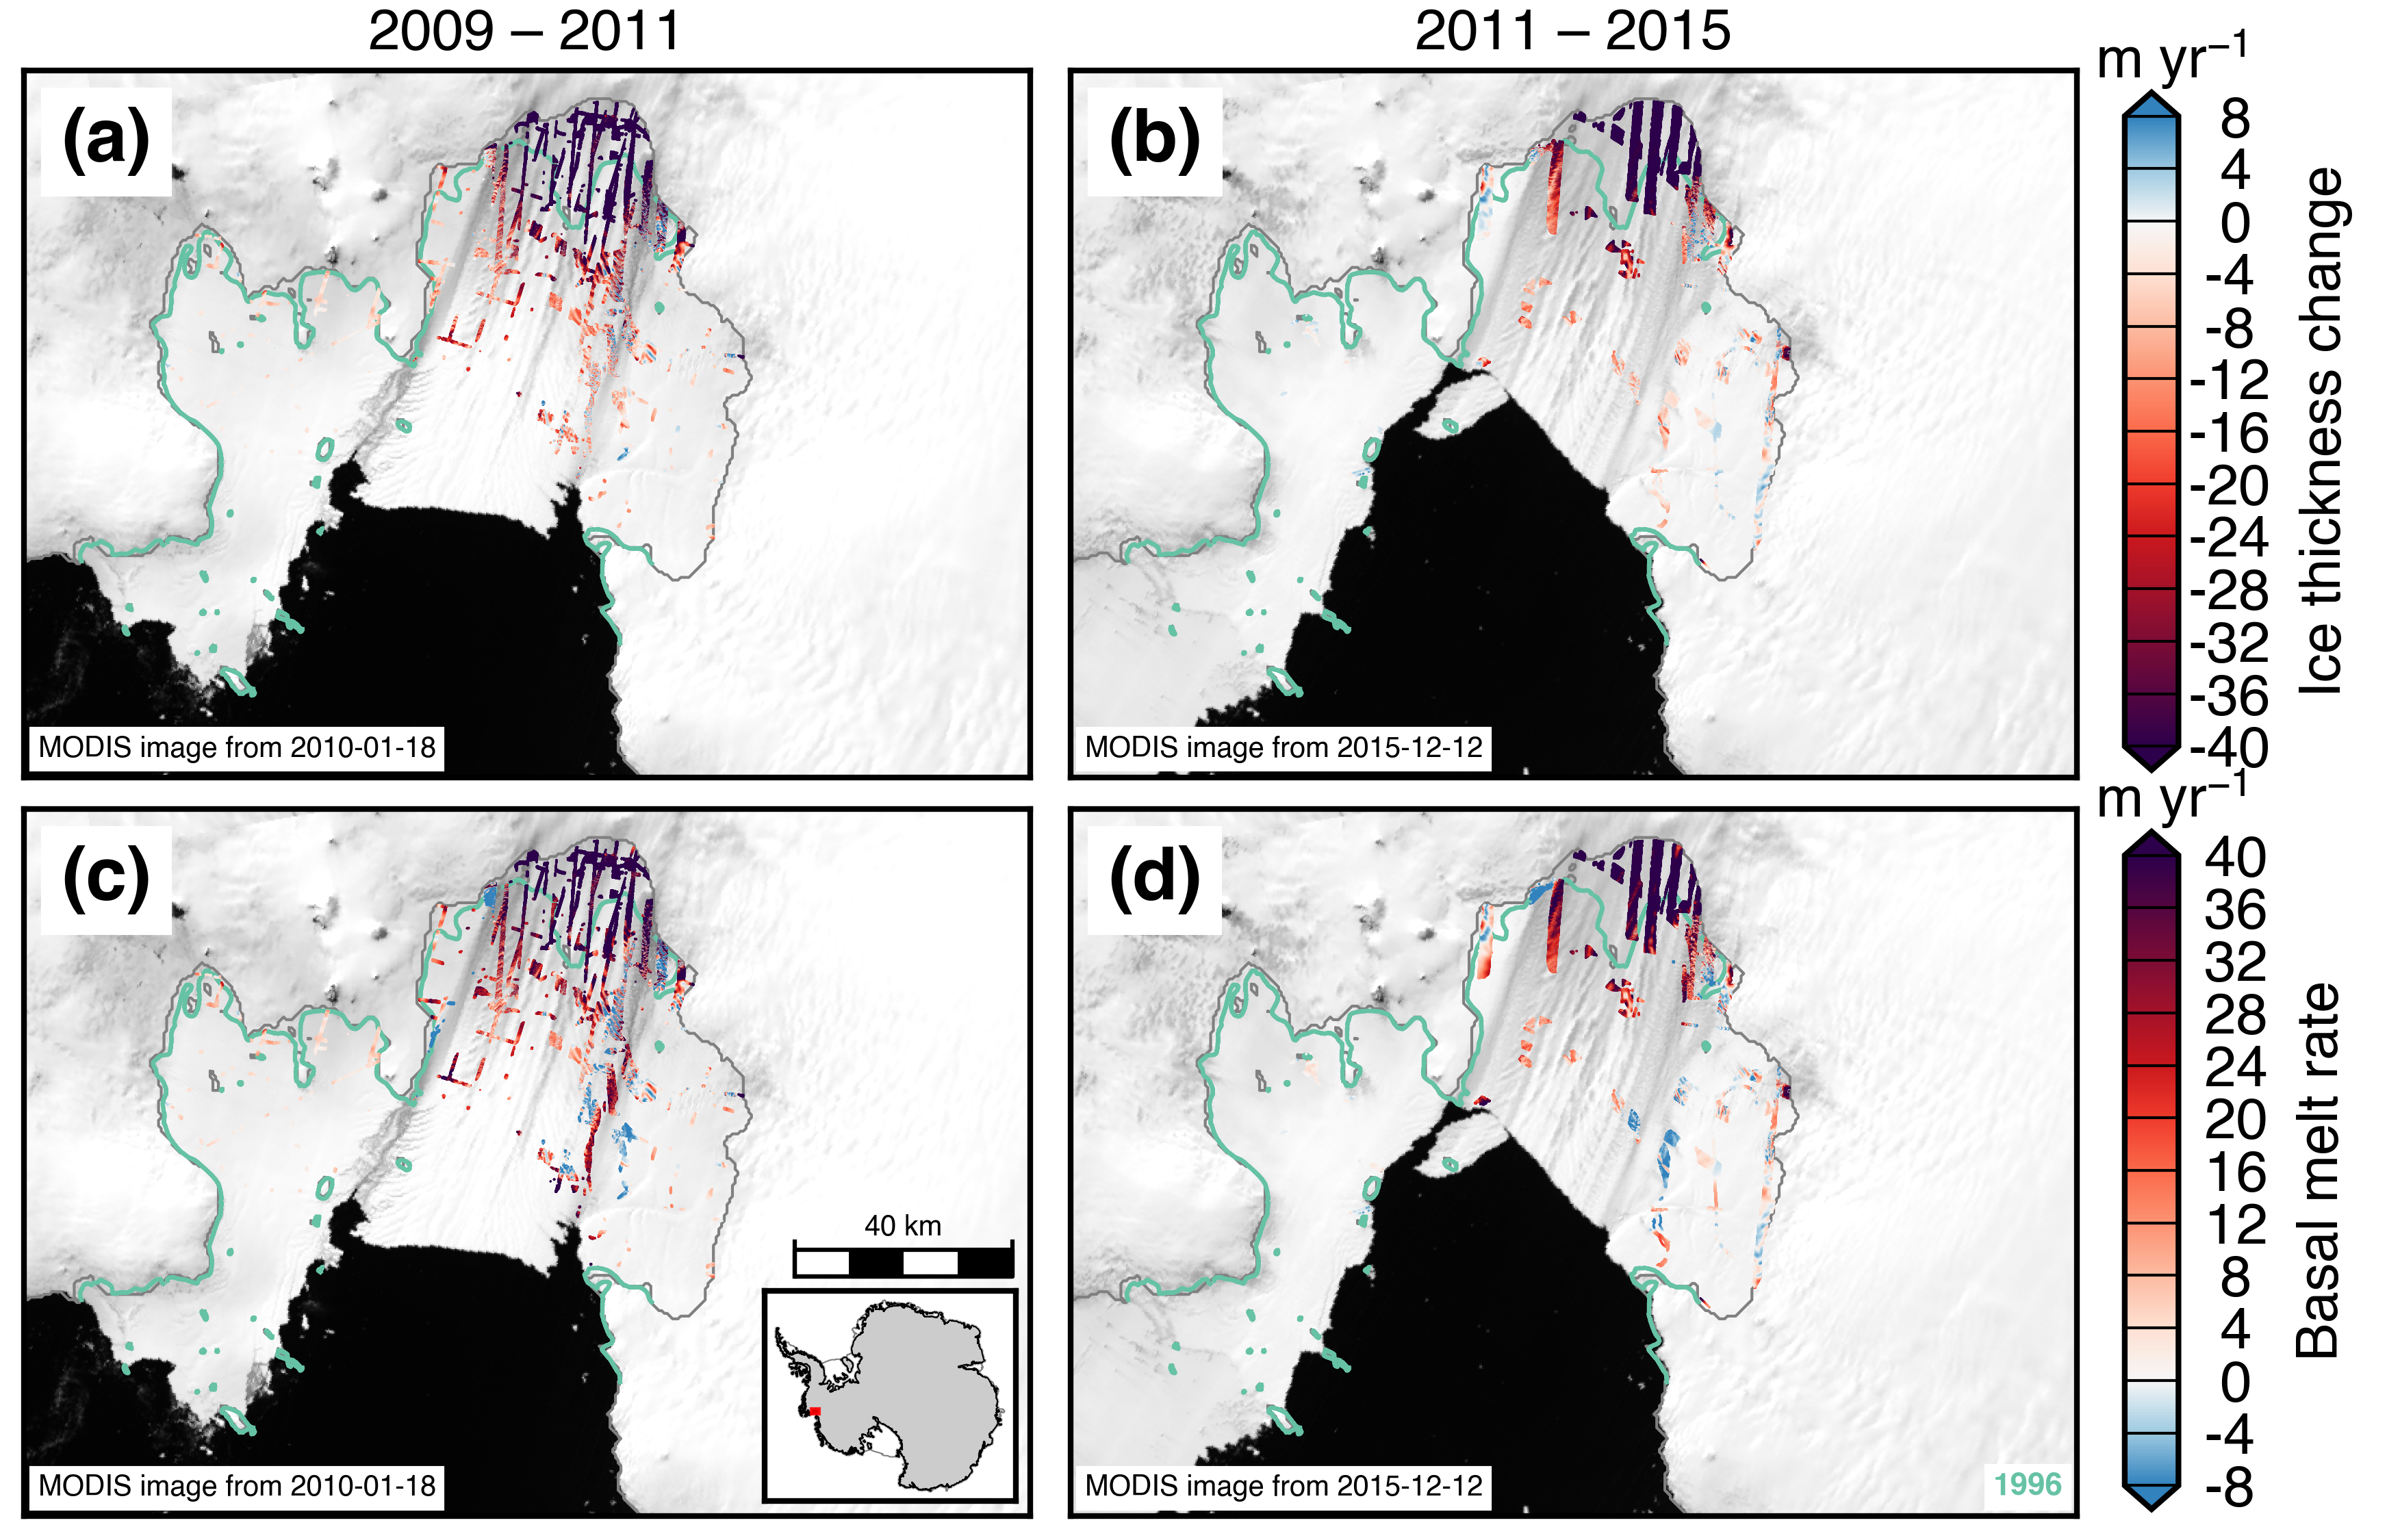
dominate contributor to the ice thickness change over the period. At the
Pine Island Ice Shelf in the critical region near in the grounding zone,
we find that ice shelf thinning rates exceed 40 m/yr with the change
dominated by strong submarine melting. Regions near the grounding zones
of the Dotson and Crosson Ice Shelves are thinning at rates greater than
40 m/yr, also due to intense basal melt. Operation IceBridge provides a
validation dataset for floating ice shelves at moderately high resolution
when co-registered using Lagrangian methods.
Data Access
Article materials © Author(s) 2019. This work is distributed under the Creative Commons Attribution 4.0 License.