Improved estimates of geocenter variability from time-variable gravity and ocean model outputs
by T. C. Sutterley and I. Velicogna
Remote Sensing, Special Issue
"Remote Sensing by Satellite Gravimetry" (2019)
Abstract:
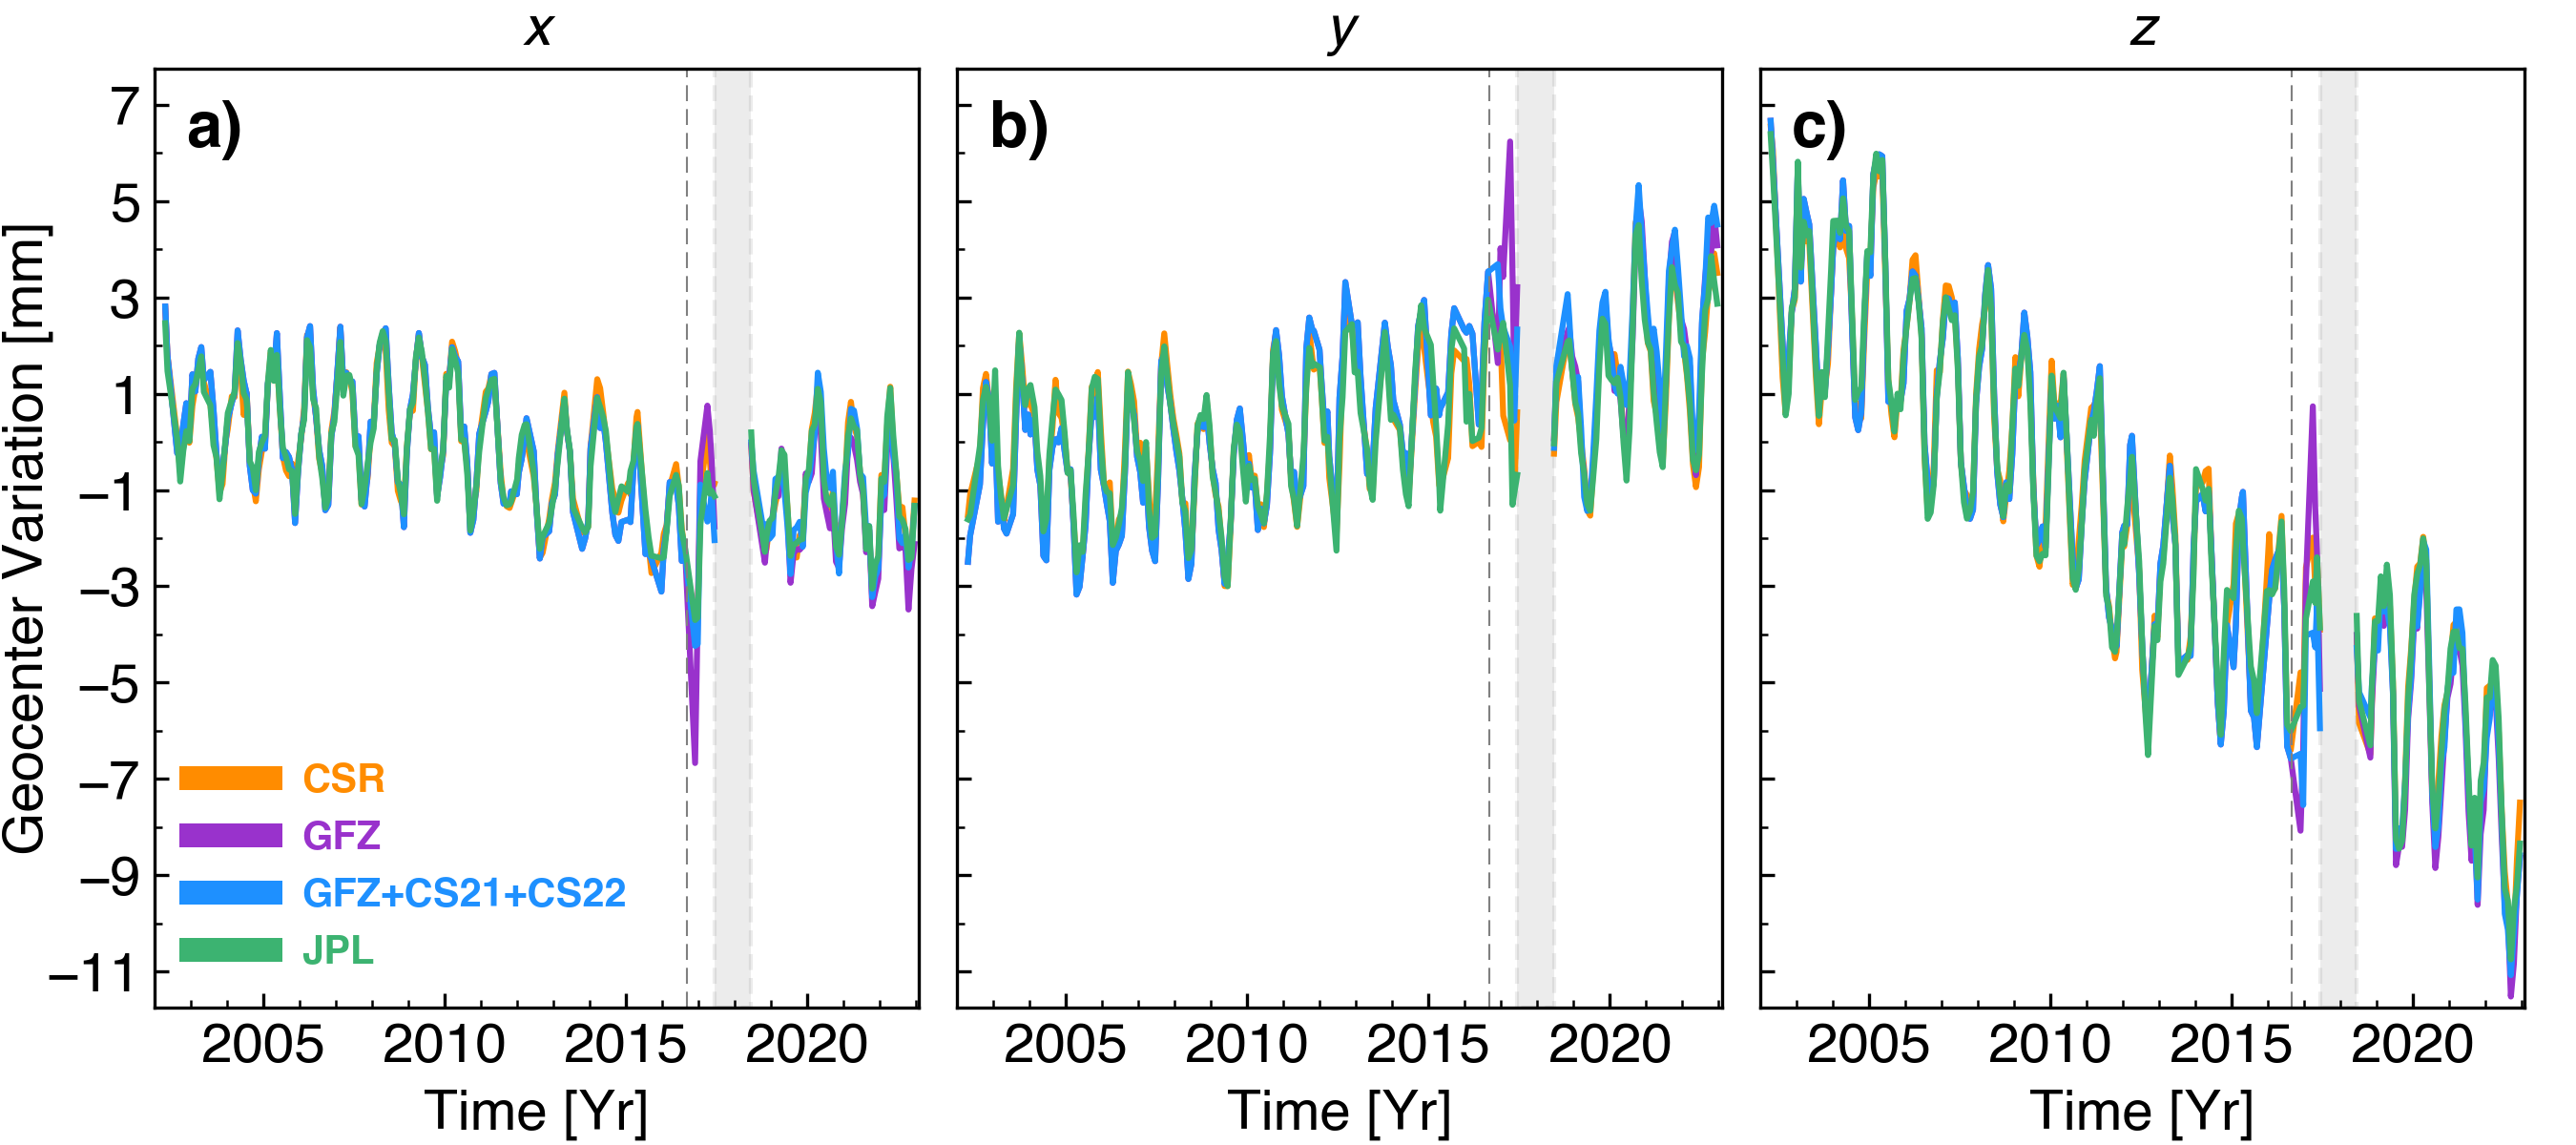
Geocenter variations relate the motion of the Earth's center of mass
with respect to its center of figure, and represent global-scale
redistributions of the Earth's mass. We investigate different techniques
for estimating of geocenter motion from combinations of time-variable
gravity measurements from the Gravity Recovery and Climate Experiment
(GRACE) and GRACE Follow-On missions, and bottom pressure outputs from
ocean models. Here, we provide self-consistent estimates of geocenter
variability incorporating the effects of self-attraction and loading,
and investigate the effect of uncertainties in atmospheric and oceanic
variation. The effects of self-attraction and loading from changes in
land water storage and ice mass change affect both the seasonality and
long-term trend in geocenter position. Omitting the redistribution of
sea level affects the average annual amplitudes of the x, y,
and z components by 0.2, 0.1, and 0.3 mm, respectively, and affects
geocenter trend estimates by 0.02, 0.04 and 0.05 mm/yr for the the
x, y, and z components, respectively. Geocenter
estimates from the GRACE Follow-On mission are consistent with estimates
from the original GRACE mission.
Data Access
This is an open access article distributed under the Creative Commons Attribution License which permits unrestricted use, distribution, and reproduction in any medium, provided the original work is properly cited.