Evaluating Greenland glacial isostatic adjustment corrections using GRACE, altimetry and surface mass balance data
by T. C. Sutterley, I. Velicogna, B. Csatho,
M. R. van den Broeke, S. Rezvanbehbahani
and G. Babonis
Environmental Research Letters (2014)
Abstract:
Glacial isostatic adjustment (GIA) represents a source of uncertainty for
ice sheet mass balance estimates from the Gravity Recovery and Climate
Experiment (GRACE) time-variable gravity measurements. We evaluate
Greenland GIA corrections from Simpson et al. (2009), A et al. (2013) and Wu
et al. (2010) by comparing the spatial patterns of GRACE-derived ice mass
trends calculated using the three corrections with volume changes from
ICESat (Ice, Cloud, and land Elevation Satellite) and OIB (Operation
IceBridge) altimetry missions, and surface mass balance (SMB) products from
the Regional Atmospheric Climate Model (RACMO). During the period September
2003–August 2011, GRACE ice mass changes obtained using the Simpson
et al. (2009) and A et al. (2013) GIA corrections yield similar spatial
patterns and amplitudes, and are consistent with altimetry observations and
surface mass balance data. The two GRACE estimates agree within 2% on
average over the entire ice sheet, and better than 15% in four
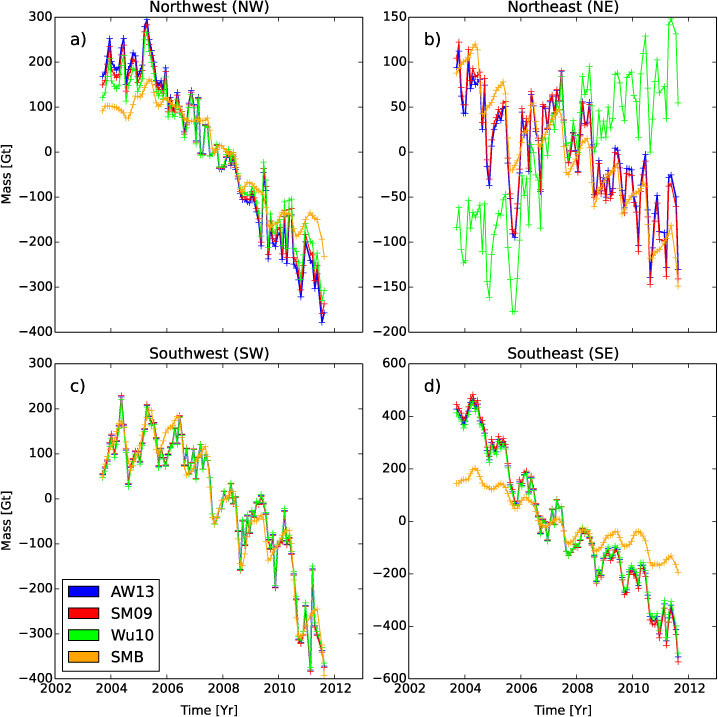
subdivisions of Greenland. The third GRACE estimate corrected using the
Wu et al. (2010) GIA shows similar spatial patterns, but produces an
average ice mass loss for the entire ice sheet that is 64 – 67 Gt
yr-1 smaller. In the Northeast the recovered ice mass change is
46 – 49 Gt yr-1 (245–270%) more positive than
that deduced from the other two corrections. By comparing the spatial and
temporal variability of the GRACE estimates with trends of volume changes
from altimetry and surface mass balance from RACMO, we show that the Wu et
al. (2010) correction leads to a large mass increase in the Northeast that
is inconsistent with independent observations.
Article materials ©2014 IOP Publishing Ltd.